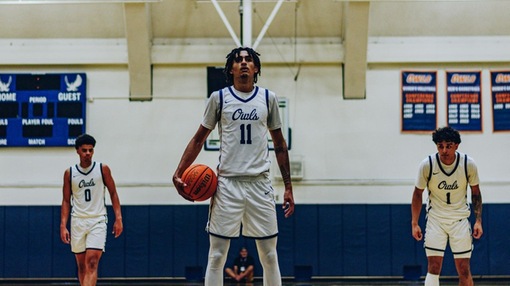
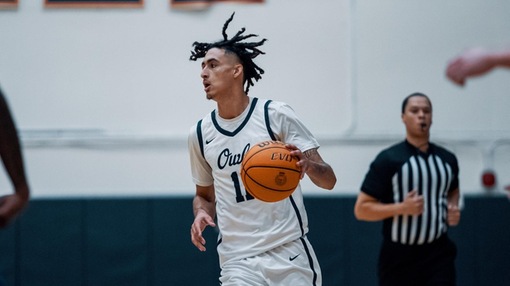
11 JJ Mitchell

-
- Height:
- 6-7
-
- Weight:
- 190
-
- Year:
- Fr.
-
- High School:
- Granada HS
-
- Position:
- Forward
-
- B/T:
- Livermore, CA
-
- gp
- 29
-
- pts/g
- 15.0
-
- fg %
- 51.0
-
- 3pt %
- 25.8
-
- ft %
- 70.2
-
- reb/g
- 8.5
-
- a/g
- 1.6
Bio
HIGH SCHOOL
Played two years of varsity basketball at Granada High School.
PERSONAL
From Livermore ... majoring in kinesiology ... favorite team is the 49ers ... favorite athlete is Lebron James.
Player Profile
| Overall | Conf | |||
|---|---|---|---|---|
| Games | 29 | 14 | ||
| Games started | 17 | 14 | ||
| Minutes | 757 | 416 | ||
| Minutes per game | 26.1 | 29.7 | ||
| FG | 176-345 | 96-177 | ||
| FG Pct | 51.0 | 54.2 | ||
| 3PT | 24-93 | 13-45 | ||
| 3PT Pct | 25.8 | 28.9 | ||
| FT | 59-84 | 37-49 | ||
| FT Pct | 70.2 | 75.5 | ||
| Off rebounds | 88 | 39 | ||
| Def rebounds | 158 | 87 | ||
| Total rebounds | 246 | 126 | ||
| Rebounds per game | 8.5 | 9.0 | ||
| Personal fouls | 60 | 32 | ||
| Disqualifications | - | - | ||
| Assists | 46 | 21 | ||
| Turnovers | 60 | 23 | ||
| Assist to turnover ratio | 0.8 | 0.9 | ||
| Steals | 50 | 24 | ||
| Blocks | 31 | 15 | ||
| Points | 435 | 242 | ||
| Points per game | 15.0 | 17.3 | ||
| Points per 40 min | 23.0 | 23.3 | ||
Game Log - Shooting
| Date | Opponent | Score | gs | min | fg | pct | 3pt | pct | ft | pct | pts |
|---|---|---|---|---|---|---|---|---|---|---|---|
| Sep 15 | at SoCal Jamboree | - | - | - | - | - | - | - | - | - | |
| Sep 16 | at SoCal Jamboree | - | - | - | - | - | - | - | - | - | |
| Nov 2 | Mt. San Antonio | L, 65-60 | - | 28 | 5-11 | 45.5 | 0-4 | 0.0 | 5-6 | 83.3 | 15 |
| Nov 7 | MiraCosta | W, 109-102 | - | 29 | 7-10 | 70.0 | 1-2 | 50.0 | 2-4 | 50.0 | 17 |
| Nov 10 | #16 Pasadena City | W, 87-66 | - | 29 | 6-12 | 50.0 | 1-3 | 33.3 | 0-0 | - | 13 |
| Nov 14 | Orange Coast | W, 90-72 | - | 22 | 7-13 | 53.8 | 1-3 | 33.3 | 3-4 | 75.0 | 18 |
| Nov 17 | #17 Cerritos | W, 94-71 | - | 19 | 1-5 | 20.0 | 0-2 | 0.0 | 0-2 | 0.0 | 2 |
| Nov 22 | Riverside | W, 97-70 | - | 23 | 12-16 | 75.0 | 1-5 | 20.0 | 0-0 | - | 25 |
| Dec 1 | Los Angeles City | W, 113-79 | - | 16 | 6-11 | 54.5 | 1-4 | 25.0 | 0-0 | - | 13 |
| Dec 2 | #22 Santiago Canyon | L, 97-88 | - | 24 | 1-6 | 16.7 | 0-3 | 0.0 | 1-2 | 50.0 | 3 |
| Dec 6 | at San Diego Miramar | W, 61-59 | 1 | 1 | 8-16 | 50.0 | 2-5 | 40.0 | 3-3 | 100.0 | 21 |
| Dec 13 | #28 West Hills Lemoore | L, 86-78 | 1 | 26 | 4-12 | 33.3 | 1-4 | 25.0 | 0-0 | - | 9 |
| Dec 16 | at #8 Cerro Coso | L, 78-59 | - | 1 | 1-6 | 16.7 | 0-1 | 0.0 | 2-2 | 100.0 | 4 |
| Dec 19 | Long Beach | W, 97-82 | - | 27 | 4-11 | 36.4 | 1-3 | 33.3 | 2-5 | 40.0 | 11 |
| Jan 2 | at #15 Moorpark | W, 115-85 | - | 22 | 9-14 | 64.3 | 1-4 | 25.0 | 0-0 | - | 19 |
| Jan 5 | #16 Allan Hancock | L, 86-74 | - | 37 | 3-8 | 37.5 | 0-3 | 0.0 | 1-2 | 50.0 | 7 |
| Jan 10 | at Bakersfield | W, 89-62 | 1 | 32 | 11-16 | 68.8 | 0-1 | 0.0 | 5-7 | 71.4 | 27 |
| Jan 13 | at Santa Monica | W, 70-63 | 1 | 24 | 8-9 | 88.9 | 0-1 | 0.0 | 1-3 | 33.3 | 17 |
| Jan 17 | Canyons | W, 99-71 | 1 | 20 | 2-3 | 66.7 | 0-0 | - | 0-0 | - | 4 |
| Jan 20 | at LA Valley | W, 82-65 | 1 | 32 | 7-11 | 63.6 | 0-1 | 0.0 | 2-4 | 50.0 | 16 |
| Jan 24 | Glendale | W, 84-62 | 1 | 27 | 8-14 | 57.1 | 1-2 | 50.0 | 2-2 | 100.0 | 19 |
| Jan 27 | Antelope Valley | W, 97-80 | 1 | 29 | 8-13 | 61.5 | 1-2 | 50.0 | 2-2 | 100.0 | 19 |
| Jan 31 | at #2 West LA | L, 87-78 | 1 | 35 | 7-15 | 46.7 | 2-9 | 22.2 | 2-2 | 100.0 | 18 |
| Feb 3 | Bakersfield | W, 74-59 | 1 | 25 | 3-4 | 75.0 | 1-1 | 100.0 | 2-3 | 66.7 | 9 |
| Feb 7 | Santa Monica | W, 80-73 | 1 | 30 | 6-13 | 46.2 | 1-2 | 50.0 | 2-2 | 100.0 | 15 |
| Feb 10 | at Canyons | W, 90-63 | 1 | 26 | 8-16 | 50.0 | 2-5 | 40.0 | 7-8 | 87.5 | 25 |
| Feb 14 | LA Valley | W, 95-82 | 1 | 32 | 7-13 | 53.8 | 1-3 | 33.3 | 8-10 | 80.0 | 23 |
| Feb 17 | at Glendale | W, 77-72 | 1 | 36 | 7-16 | 43.8 | 1-6 | 16.7 | 0-0 | - | 15 |
| Feb 21 | at Antelope Valley | L, 87-76 | 1 | 30 | 9-16 | 56.3 | 1-3 | 33.3 | 0-0 | - | 19 |
| Feb 23 | #9 West LA | W, 74-64 | 1 | 38 | 5-18 | 27.8 | 2-9 | 22.2 | 4-6 | 66.7 | 16 |
| Mar 2 | #16 Cerro Coso | L, 68-64 | 1 | 37 | 6-17 | 35.3 | 1-2 | 50.0 | 3-5 | 60.0 | 16 |
Game Log - Ball control
| Date | Opponent | Score | gs | min | off | def | reb | ast | to | a/to | stl | blk | pf | dq |
|---|---|---|---|---|---|---|---|---|---|---|---|---|---|---|
| Sep 15 | at SoCal Jamboree | - | - | - | - | - | - | - | - | - | - | - | - | |
| Sep 16 | at SoCal Jamboree | - | - | - | - | - | - | - | - | - | - | - | - | |
| Nov 2 | Mt. San Antonio | L, 65-60 | - | 28 | 3 | 8 | 11 | 2 | 3 | 0.7 | 3 | 2 | 4 | - |
| Nov 7 | MiraCosta | W, 109-102 | - | 29 | 6 | 3 | 9 | 1 | 4 | 0.3 | 3 | 1 | 2 | - |
| Nov 10 | #16 Pasadena City | W, 87-66 | - | 29 | 4 | 4 | 8 | 3 | 3 | 1.0 | 3 | 2 | 1 | - |
| Nov 14 | Orange Coast | W, 90-72 | - | 22 | 2 | 11 | 13 | 2 | 3 | 0.7 | 0 | 2 | 2 | - |
| Nov 17 | #17 Cerritos | W, 94-71 | - | 19 | 1 | 3 | 4 | 1 | 2 | 0.5 | 2 | 1 | 3 | - |
| Nov 22 | Riverside | W, 97-70 | - | 23 | 3 | 2 | 5 | 2 | 3 | 0.7 | 4 | 2 | 3 | - |
| Dec 1 | Los Angeles City | W, 113-79 | - | 16 | 3 | 4 | 7 | 3 | 2 | 1.5 | 4 | 1 | 3 | - |
| Dec 2 | #22 Santiago Canyon | L, 97-88 | - | 24 | 3 | 5 | 8 | 3 | 1 | 3.0 | 2 | 0 | 0 | - |
| Dec 6 | at San Diego Miramar | W, 61-59 | 1 | 1 | 5 | 6 | 11 | 0 | 3 | 0.0 | 1 | 0 | 0 | - |
| Dec 13 | #28 West Hills Lemoore | L, 86-78 | 1 | 26 | 4 | 2 | 6 | 1 | 3 | 0.3 | 0 | 1 | 1 | - |
| Dec 16 | at #8 Cerro Coso | L, 78-59 | - | 1 | 1 | 2 | 3 | 2 | 1 | 2.0 | 0 | 0 | 1 | - |
| Dec 19 | Long Beach | W, 97-82 | - | 27 | 2 | 5 | 7 | 0 | 4 | 0.0 | 1 | 1 | 3 | - |
| Jan 2 | at #15 Moorpark | W, 115-85 | - | 22 | 2 | 5 | 7 | 3 | 4 | 0.8 | 0 | 2 | 2 | - |
| Jan 5 | #16 Allan Hancock | L, 86-74 | - | 37 | 1 | 3 | 4 | 2 | 0 | - | 1 | 0 | 2 | - |
| Jan 10 | at Bakersfield | W, 89-62 | 1 | 32 | 3 | 3 | 6 | 2 | 2 | 1.0 | 3 | 2 | 2 | - |
| Jan 13 | at Santa Monica | W, 70-63 | 1 | 24 | 2 | 5 | 7 | 1 | 1 | 1.0 | 1 | 2 | 4 | - |
| Jan 17 | Canyons | W, 99-71 | 1 | 20 | 0 | 4 | 4 | 2 | 2 | 1.0 | 2 | 0 | 3 | - |
| Jan 20 | at LA Valley | W, 82-65 | 1 | 32 | 3 | 9 | 12 | 4 | 1 | 4.0 | 2 | 1 | 3 | - |
| Jan 24 | Glendale | W, 84-62 | 1 | 27 | 4 | 7 | 11 | 1 | 2 | 0.5 | 2 | 2 | 2 | - |
| Jan 27 | Antelope Valley | W, 97-80 | 1 | 29 | 6 | 8 | 14 | 2 | 3 | 0.7 | 0 | 0 | 2 | - |
| Jan 31 | at #2 West LA | L, 87-78 | 1 | 35 | 2 | 5 | 7 | 1 | 0 | - | 1 | 0 | 4 | - |
| Feb 3 | Bakersfield | W, 74-59 | 1 | 25 | 1 | 2 | 3 | 2 | 1 | 2.0 | 1 | 0 | 0 | - |
| Feb 7 | Santa Monica | W, 80-73 | 1 | 30 | 2 | 4 | 6 | 3 | 0 | - | 0 | 0 | 2 | - |
| Feb 10 | at Canyons | W, 90-63 | 1 | 26 | 4 | 10 | 14 | 0 | 4 | 0.0 | 2 | 0 | 2 | - |
| Feb 14 | LA Valley | W, 95-82 | 1 | 32 | 4 | 7 | 11 | 2 | 3 | 0.7 | 4 | 1 | 1 | - |
| Feb 17 | at Glendale | W, 77-72 | 1 | 36 | 1 | 6 | 7 | 1 | 1 | 1.0 | 1 | 2 | 2 | - |
| Feb 21 | at Antelope Valley | L, 87-76 | 1 | 30 | 3 | 5 | 8 | 0 | 1 | 0.0 | 2 | 0 | 2 | - |
| Feb 23 | #9 West LA | W, 74-64 | 1 | 38 | 4 | 12 | 16 | 0 | 2 | 0.0 | 3 | 5 | 3 | - |
| Mar 2 | #16 Cerro Coso | L, 68-64 | 1 | 37 | 9 | 8 | 17 | 0 | 1 | 0.0 | 2 | 1 | 1 | - |
Career Stats - Shooting per game
| gp | gs | min/g | fg/g | pct | 3pt/g | pct | ft/g | pct | ppg | |
|---|---|---|---|---|---|---|---|---|---|---|
| 2023-24 | 29 | 17 | 26.1 | 6.1-11.9 | 51.0 | 0.8-3.2 | 25.8 | 2.0-2.9 | 70.2 | 15.0 |
| Total | 29 | 17 | 26.1 | 6.1-11.9 | 51.0 | 0.8-3.2 | 25.8 | 2.0-2.9 | 70.2 | 15.0 |
Career Stats - Shooting totals
| gp | gs | min | fg | pct | 3pt | pct | ft | pct | pts | |
|---|---|---|---|---|---|---|---|---|---|---|
| 2023-24 | 29 | 17 | 757 | 176-345 | 51.0 | 24-93 | 25.8 | 59-84 | 70.2 | 435 |
| Total | 29 | 17 | 757 | 176-345 | 51.0 | 24-93 | 25.8 | 59-84 | 70.2 | 435 |
Career Stats - Shooting per 40 min
| gp | gs | min/g | fg/40 | pct | 3pt/40 | pct | ft/40 | pct | pts/40 | |
|---|---|---|---|---|---|---|---|---|---|---|
| 2023-24 | 29 | 17 | 26.1 | 9.3-18.2 | 51.0 | 1.3-4.9 | 25.8 | 3.1-4.4 | 70.2 | 23.0 |
| Total | 29 | 17 | 26.1 | 9.3-18.2 | 51.0 | 1.3-4.9 | 25.8 | 3.1-4.4 | 70.2 | 23.0 |
Career Stats - Ball control per game
| gp | gs | mpg | off/g | def/g | reb/g | pf/g | dq/g | ast/g | to/g | a/to | stl/g | blk/g | |
|---|---|---|---|---|---|---|---|---|---|---|---|---|---|
| 2023-24 | 29 | 17 | 26.1 | 3.0 | 5.4 | 8.5 | 2.1 | - | 1.6 | 2.1 | 0.8 | 1.7 | 1.1 |
| Total | 29 | 17 | 26.1 | 3.0 | 5.4 | 8.5 | 2.1 | - | 1.6 | 2.1 | 0.8 | 1.7 | 1.1 |
Career Stats - Ball control totals
| gp | gs | min | off | def | reb | pf | dq | ast | to | a/to | stl | blk | |
|---|---|---|---|---|---|---|---|---|---|---|---|---|---|
| 2023-24 | 29 | 17 | 757 | 88 | 158 | 246 | 60 | - | 46 | 60 | 0.8 | 50 | 31 |
| Total | 29 | 17 | 757 | 88 | 158 | 246 | 60 | - | 46 | 60 | 0.8 | 50 | 31 |
Career Stats - Ball control per 40 min
| gp | gs | mpg | off/40 | def/40 | reb/40 | pf/40 | dq/40 | ast/40 | to/40 | a/to | stl/40 | blk/40 | |
|---|---|---|---|---|---|---|---|---|---|---|---|---|---|
| 2023-24 | 29 | 17 | 26.1 | 4.6 | 8.3 | 13.0 | 3.2 | 0.0 | 2.4 | 3.2 | 0.8 | 2.6 | 1.6 |
| Total | 29 | 17 | 26.1 | 4.6 | 8.3 | 13.0 | 3.2 | 0.0 | 2.4 | 3.2 | 0.8 | 2.6 | 1.6 |
Splits Stats - Shooting per game
| gp | gs | min/g | fg/g | pct | 3pt/g | pct | ft/g | pct | ppg | ||
|---|---|---|---|---|---|---|---|---|---|---|---|
| Event | Total | 29 | 17 | 26.1 | 6.1-11.9 | 51.0 | 0.8-3.2 | 25.8 | 2.0-2.9 | 70.2 | 15.0 |
| Conference | 14 | 14 | 29.7 | 6.9-12.6 | 54.2 | 0.9-3.2 | 28.9 | 2.6-3.5 | 75.5 | 17.3 | |
| Exhibition | - | - | - | 0.0-0.0 | - | 0.0-0.0 | - | 0.0-0.0 | - | - | |
| Location | Home | 19 | 9 | 27.3 | 5.3-11.1 | 48.1 | 0.8-3.0 | 26.3 | 1.9-2.9 | 67.3 | 13.4 |
| Away | 10 | 8 | 23.9 | 7.5-13.5 | 55.6 | 0.9-3.6 | 25.0 | 2.2-2.9 | 75.9 | 18.1 | |
| Neutral | - | - | - | 0.0-0.0 | - | 0.0-0.0 | - | 0.0-0.0 | - | - | |
| Result | Wins | 21 | 13 | 25.7 | 6.7-12.1 | 55.1 | 0.9-3.0 | 29.7 | 2.1-3.1 | 69.2 | 16.4 |
| Losses | 8 | 4 | 27.3 | 4.5-11.4 | 39.6 | 0.6-3.6 | 17.2 | 1.8-2.4 | 73.7 | 11.4 | |
| Month | November | 6 | - | 25.0 | 6.3-11.2 | 56.7 | 0.7-3.2 | 21.1 | 1.7-2.7 | 62.5 | 15.0 |
| December | 6 | 2 | 15.8 | 4.0-10.3 | 38.7 | 0.8-3.3 | 25.0 | 1.3-2.0 | 66.7 | 10.2 | |
| January | 9 | 7 | 28.7 | 7.0-11.4 | 61.2 | 0.6-2.6 | 21.7 | 1.7-2.4 | 68.2 | 16.2 | |
| February | 7 | 7 | 31.0 | 6.4-13.7 | 46.9 | 1.3-4.1 | 31.0 | 3.3-4.1 | 79.3 | 17.4 | |
| March | 1 | 1 | 37.0 | 6.0-17.0 | 35.3 | 1.0-2.0 | 50.0 | 3.0-5.0 | 60.0 | 16.0 |
Splits Stats - Shooting totals
| gp | gs | min | fg | pct | 3pt | pct | ft | pct | pts | ||
|---|---|---|---|---|---|---|---|---|---|---|---|
| Event | Total | 29 | 17 | 757 | 176-345 | 51.0 | 24-93 | 25.8 | 59-84 | 70.2 | 435 |
| Conference | 14 | 14 | 416 | 96-177 | 54.2 | 13-45 | 28.9 | 37-49 | 75.5 | 242 | |
| Exhibition | - | - | - | 0-0 | - | 0-0 | - | 0-0 | - | 0 | |
| Location | Home | 19 | 9 | 518 | 101-210 | 48.1 | 15-57 | 26.3 | 37-55 | 67.3 | 254 |
| Away | 10 | 8 | 239 | 75-135 | 55.6 | 9-36 | 25.0 | 22-29 | 75.9 | 181 | |
| Neutral | - | - | - | 0-0 | - | 0-0 | - | 0-0 | - | 0 | |
| Result | Wins | 21 | 13 | 539 | 140-254 | 55.1 | 19-64 | 29.7 | 45-65 | 69.2 | 344 |
| Losses | 8 | 4 | 218 | 36-91 | 39.6 | 5-29 | 17.2 | 14-19 | 73.7 | 91 | |
| Month | November | 6 | - | 150 | 38-67 | 56.7 | 4-19 | 21.1 | 10-16 | 62.5 | 90 |
| December | 6 | 2 | 95 | 24-62 | 38.7 | 5-20 | 25.0 | 8-12 | 66.7 | 61 | |
| January | 9 | 7 | 258 | 63-103 | 61.2 | 5-23 | 21.7 | 15-22 | 68.2 | 146 | |
| February | 7 | 7 | 217 | 45-96 | 46.9 | 9-29 | 31.0 | 23-29 | 79.3 | 122 | |
| March | 1 | 1 | 37 | 6-17 | 35.3 | 1-2 | 50.0 | 3-5 | 60.0 | 16 |
Splits Stats - Shooting per 40 min
| gp | gs | min/g | fg/40 | pct | 3pt/40 | pct | ft/40 | pct | pts/40 | ||
|---|---|---|---|---|---|---|---|---|---|---|---|
| Event | Total | 29 | 17 | 26.1 | 9.3-18.2 | 51.0 | 1.3-4.9 | 25.8 | 3.1-4.4 | 70.2 | 23.0 |
| Conference | 14 | 14 | 29.7 | 9.2-17.0 | 54.2 | 1.2-4.3 | 28.9 | 3.6-4.7 | 75.5 | 23.3 | |
| Exhibition | - | - | - | 0.0-0.0 | - | 0.0-0.0 | - | 0.0-0.0 | - | - | |
| Location | Home | 19 | 9 | 27.3 | 7.8-16.2 | 48.1 | 1.2-4.4 | 26.3 | 2.9-4.2 | 67.3 | 19.6 |
| Away | 10 | 8 | 23.9 | 12.6-22.6 | 55.6 | 1.5-6.0 | 25.0 | 3.7-4.9 | 75.9 | 30.3 | |
| Neutral | - | - | - | 0.0-0.0 | - | 0.0-0.0 | - | 0.0-0.0 | - | - | |
| Result | Wins | 21 | 13 | 25.7 | 10.4-18.8 | 55.1 | 1.4-4.7 | 29.7 | 3.3-4.8 | 69.2 | 25.5 |
| Losses | 8 | 4 | 27.3 | 6.6-16.7 | 39.6 | 0.9-5.3 | 17.2 | 2.6-3.5 | 73.7 | 16.7 | |
| Month | November | 6 | - | 25.0 | 10.1-17.9 | 56.7 | 1.1-5.1 | 21.1 | 2.7-4.3 | 62.5 | 24.0 |
| December | 6 | 2 | 15.8 | 10.1-26.1 | 38.7 | 2.1-8.4 | 25.0 | 3.4-5.1 | 66.7 | 25.7 | |
| January | 9 | 7 | 28.7 | 9.8-16.0 | 61.2 | 0.8-3.6 | 21.7 | 2.3-3.4 | 68.2 | 22.6 | |
| February | 7 | 7 | 31.0 | 8.3-17.7 | 46.9 | 1.7-5.3 | 31.0 | 4.2-5.3 | 79.3 | 22.5 | |
| March | 1 | 1 | 37.0 | 6.5-18.4 | 35.3 | 1.1-2.2 | 50.0 | 3.2-5.4 | 60.0 | 17.3 |
Splits Stats - Ball control per game
| gp | gs | mpg | off/g | def/g | reb/g | pf/g | dq/g | ast/g | to/g | a/to | stl/g | blk/g | ||
|---|---|---|---|---|---|---|---|---|---|---|---|---|---|---|
| Event | Total | 29 | 17 | 26.1 | 3.0 | 5.4 | 8.5 | 2.1 | - | 1.6 | 2.1 | 0.8 | 1.7 | 1.1 |
| Conference | 14 | 14 | 29.7 | 2.8 | 6.2 | 9.0 | 2.3 | - | 1.5 | 1.6 | 0.9 | 1.7 | 1.1 | |
| Exhibition | - | - | - | - | - | - | - | - | - | - | - | - | - | |
| Location | Home | 19 | 9 | 27.3 | 3.3 | 5.4 | 8.6 | 2.0 | - | 1.7 | 2.2 | 0.8 | 1.9 | 1.2 |
| Away | 10 | 8 | 23.9 | 2.6 | 5.6 | 8.2 | 2.2 | - | 1.4 | 1.8 | 0.8 | 1.3 | 0.9 | |
| Neutral | - | - | - | - | - | - | - | - | - | - | - | - | - | |
| Result | Wins | 21 | 13 | 25.7 | 3.0 | 5.7 | 8.7 | 2.1 | - | 1.7 | 2.4 | 0.7 | 1.9 | 1.3 |
| Losses | 8 | 4 | 27.3 | 3.3 | 4.8 | 8.0 | 1.9 | - | 1.4 | 1.3 | 1.1 | 1.4 | 0.5 | |
| Month | November | 6 | - | 25.0 | 3.2 | 5.2 | 8.3 | 2.5 | - | 1.8 | 3.0 | 0.6 | 2.5 | 1.7 |
| December | 6 | 2 | 15.8 | 3.0 | 4.0 | 7.0 | 1.3 | - | 1.5 | 2.3 | 0.6 | 1.3 | 0.5 | |
| January | 9 | 7 | 28.7 | 2.6 | 5.4 | 8.0 | 2.7 | - | 2.0 | 1.7 | 1.2 | 1.3 | 1.0 | |
| February | 7 | 7 | 31.0 | 2.7 | 6.6 | 9.3 | 1.7 | - | 1.1 | 1.7 | 0.7 | 1.9 | 1.1 | |
| March | 1 | 1 | 37.0 | 9.0 | 8.0 | 17.0 | 1.0 | - | 0.0 | 1.0 | 0.0 | 2.0 | 1.0 |
Splits Stats - Ball control totals
| gp | gs | min | off | def | reb | pf | dq | ast | to | a/to | stl | blk | ||
|---|---|---|---|---|---|---|---|---|---|---|---|---|---|---|
| Event | Total | 29 | 17 | 757 | 88 | 158 | 246 | 60 | - | 46 | 60 | 0.8 | 50 | 31 |
| Conference | 14 | 14 | 416 | 39 | 87 | 126 | 32 | - | 21 | 23 | 0.9 | 24 | 15 | |
| Exhibition | - | - | - | - | - | - | - | - | - | - | - | - | - | |
| Location | Home | 19 | 9 | 518 | 62 | 102 | 164 | 38 | - | 32 | 42 | 0.8 | 37 | 22 |
| Away | 10 | 8 | 239 | 26 | 56 | 82 | 22 | - | 14 | 18 | 0.8 | 13 | 9 | |
| Neutral | - | - | - | - | - | - | - | - | - | - | - | - | - | |
| Result | Wins | 21 | 13 | 539 | 62 | 120 | 182 | 45 | - | 35 | 50 | 0.7 | 39 | 27 |
| Losses | 8 | 4 | 218 | 26 | 38 | 64 | 15 | - | 11 | 10 | 1.1 | 11 | 4 | |
| Month | November | 6 | - | 150 | 19 | 31 | 50 | 15 | - | 11 | 18 | 0.6 | 15 | 10 |
| December | 6 | 2 | 95 | 18 | 24 | 42 | 8 | - | 9 | 14 | 0.6 | 8 | 3 | |
| January | 9 | 7 | 258 | 23 | 49 | 72 | 24 | - | 18 | 15 | 1.2 | 12 | 9 | |
| February | 7 | 7 | 217 | 19 | 46 | 65 | 12 | - | 8 | 12 | 0.7 | 13 | 8 | |
| March | 1 | 1 | 37 | 9 | 8 | 17 | 1 | - | 0 | 1 | 0.0 | 2 | 1 |
Splits Stats - Ball control per 40 min
| gp | gs | mpg | off/40 | def/40 | reb/40 | pf/40 | dq/40 | ast/40 | to/40 | a/to | stl/40 | blk/40 | ||
|---|---|---|---|---|---|---|---|---|---|---|---|---|---|---|
| Event | Total | 29 | 17 | 26.1 | 4.6 | 8.3 | 13.0 | 3.2 | 0.0 | 2.4 | 3.2 | 0.8 | 2.6 | 1.6 |
| Conference | 14 | 14 | 29.7 | 3.8 | 8.4 | 12.1 | 3.1 | 0.0 | 2.0 | 2.2 | 0.9 | 2.3 | 1.4 | |
| Exhibition | - | - | - | - | - | - | - | - | - | - | - | - | - | |
| Location | Home | 19 | 9 | 27.3 | 4.8 | 7.9 | 12.7 | 2.9 | 0.0 | 2.5 | 3.2 | 0.8 | 2.9 | 1.7 |
| Away | 10 | 8 | 23.9 | 4.4 | 9.4 | 13.7 | 3.7 | 0.0 | 2.3 | 3.0 | 0.8 | 2.2 | 1.5 | |
| Neutral | - | - | - | - | - | - | - | - | - | - | - | - | - | |
| Result | Wins | 21 | 13 | 25.7 | 4.6 | 8.9 | 13.5 | 3.3 | 0.0 | 2.6 | 3.7 | 0.7 | 2.9 | 2.0 |
| Losses | 8 | 4 | 27.3 | 4.8 | 7.0 | 11.7 | 2.8 | 0.0 | 2.0 | 1.8 | 1.1 | 2.0 | 0.7 | |
| Month | November | 6 | - | 25.0 | 5.1 | 8.3 | 13.3 | 4.0 | 0.0 | 2.9 | 4.8 | 0.6 | 4.0 | 2.7 |
| December | 6 | 2 | 15.8 | 7.6 | 10.1 | 17.7 | 3.4 | 0.0 | 3.8 | 5.9 | 0.6 | 3.4 | 1.3 | |
| January | 9 | 7 | 28.7 | 3.6 | 7.6 | 11.2 | 3.7 | 0.0 | 2.8 | 2.3 | 1.2 | 1.9 | 1.4 | |
| February | 7 | 7 | 31.0 | 3.5 | 8.5 | 12.0 | 2.2 | 0.0 | 1.5 | 2.2 | 0.7 | 2.4 | 1.5 | |
| March | 1 | 1 | 37.0 | 9.7 | 8.6 | 18.4 | 1.1 | 0.0 | 0.0 | 1.1 | 0.0 | 2.2 | 1.1 |
News Mentions

Lauer, Five Owls Earn All-WSC Honors
March 5, 2024

Owls Close Season Against Coyotes
March 2, 2024

Citrus Secures Sixth Conference Championship in Seven Seasons
February 23, 2024

Owls Drop Final WSC Road Game
February 21, 2024
Citrus Capitalizes On Charity Stripe Chances
February 17, 2024

Citrus Grabs Fourth-Straight Win
February 14, 2024

Owls Dominate Perimeter Game
February 10, 2024

Creger Leads Citrus to Victory
February 7, 2024

Citrus Drops Ranked Showdown to #2 West LA
January 31, 2024

Owls Bring Double Trouble for the Marauders
January 27, 2024

Owls Vanquish Vaqueros
January 24, 2024

Owls Keep Rolling With Fourth-Straight Win
January 20, 2024

Owls Battle to Grab Come-From-Behind Victory
January 13, 2024

Owls Open Conference With Victory
January 10, 2024

Owls Tip Off New Year in Dominant Fashion
January 2, 2024

Owls Get Back to Winning Ways
December 19, 2023

Bryson Ties Steals Record in Citrus Defeat
December 13, 2023
Owls Escape Jets With Narrow Victory
December 6, 2023

Citrus Scores Most Points in 15 Years
December 1, 2023

Owls Fly Past Tigers in Fifth-Straight Win
November 22, 2023

Citrus Grabs Second Victory Over Ranked Foe
November 17, 2023

Citrus Overcomes Rough First Half in OCC Win
November 14, 2023

Owls Fly Past Lancers in Ranked Showdown
November 10, 2023

Owls Hang On for Overtime Win
November 7, 2023

Citrus Drops Season Opener
November 2, 2023